Tomography is commonly used within medicine as means to visualize e.g. internal organs. However, the method can be applied in other fields as well and tomography for spray visualization in not uncommon either. It is based on detecting the integrated attenuation of light through the sample at several angles and from this dataset calculate "backwards" how the sample's interior looks like. There are many ways of performing this calculation, for example "filtered back-projection".
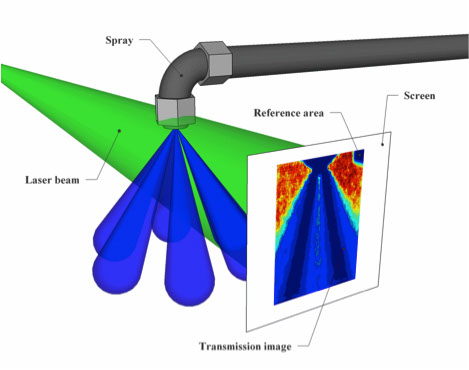
The figure to the left shows an illustration of a transmission measurement performed on an atomizing spray. By comparing this 2D attenuation map with one reference, where the spray is off, it is possible to calculate how much light was attenuated for each pixel location. This dataset (many different viewing angles) is then analyzed to determine the local attenuation inside the spray.
The above animation shows the principle of the filtered back-projection algorithm. In the example, three attenuating objects are illuminated from above and the transmitted light is registered. The sample is then rotated around its center and for each position the attenuation is measured. All views (in this case in 1D only) are then stacked together, forming what is referred to as a "sinogram" (middle image). To assess the structure of the sample, each attenuation view is then "smeared backwards" over the entire sample matrix (right image), as though the attenuation occurred equally over the entire sample. By viewing the sample from a sufficient number of angles, the distribution of the attenuators becomes apparent.
Although the above animation illustrated the tomography approach for 1D transmission measurements (which gives 2D information), the process can be carried out in 2D as well (thus giving 3D information). The image to the right shows such a measurement, performed on a 6-hole GDI water spray. One of the main benefits with tomography is that it gives quantitative information; it reveals how much light was attenuated in each pixel (or voxel). Quantitative information is highly desired, since it makes it possible to compare measurements performed at one institute with measurements performed elsewhere.
- E. Kristensson, E. Berrocal and M. Aldén, Quantitative 3D imaging of scattering media using structured illumination and computed tomography, Opt. Express, 20, 14437-14450, 2012.
